Building Costs (Input Costs) For The Construction Industry
Over the past 30 years building costs have continued to increase year on year.
Data comes from the ABS 6408.0 (Price Index of Materials Used in House Building, Six State Capital Cities,) and ABS 6427.0 (Producer Price Indexes, Input to the house construction industry)
What does the data show us:
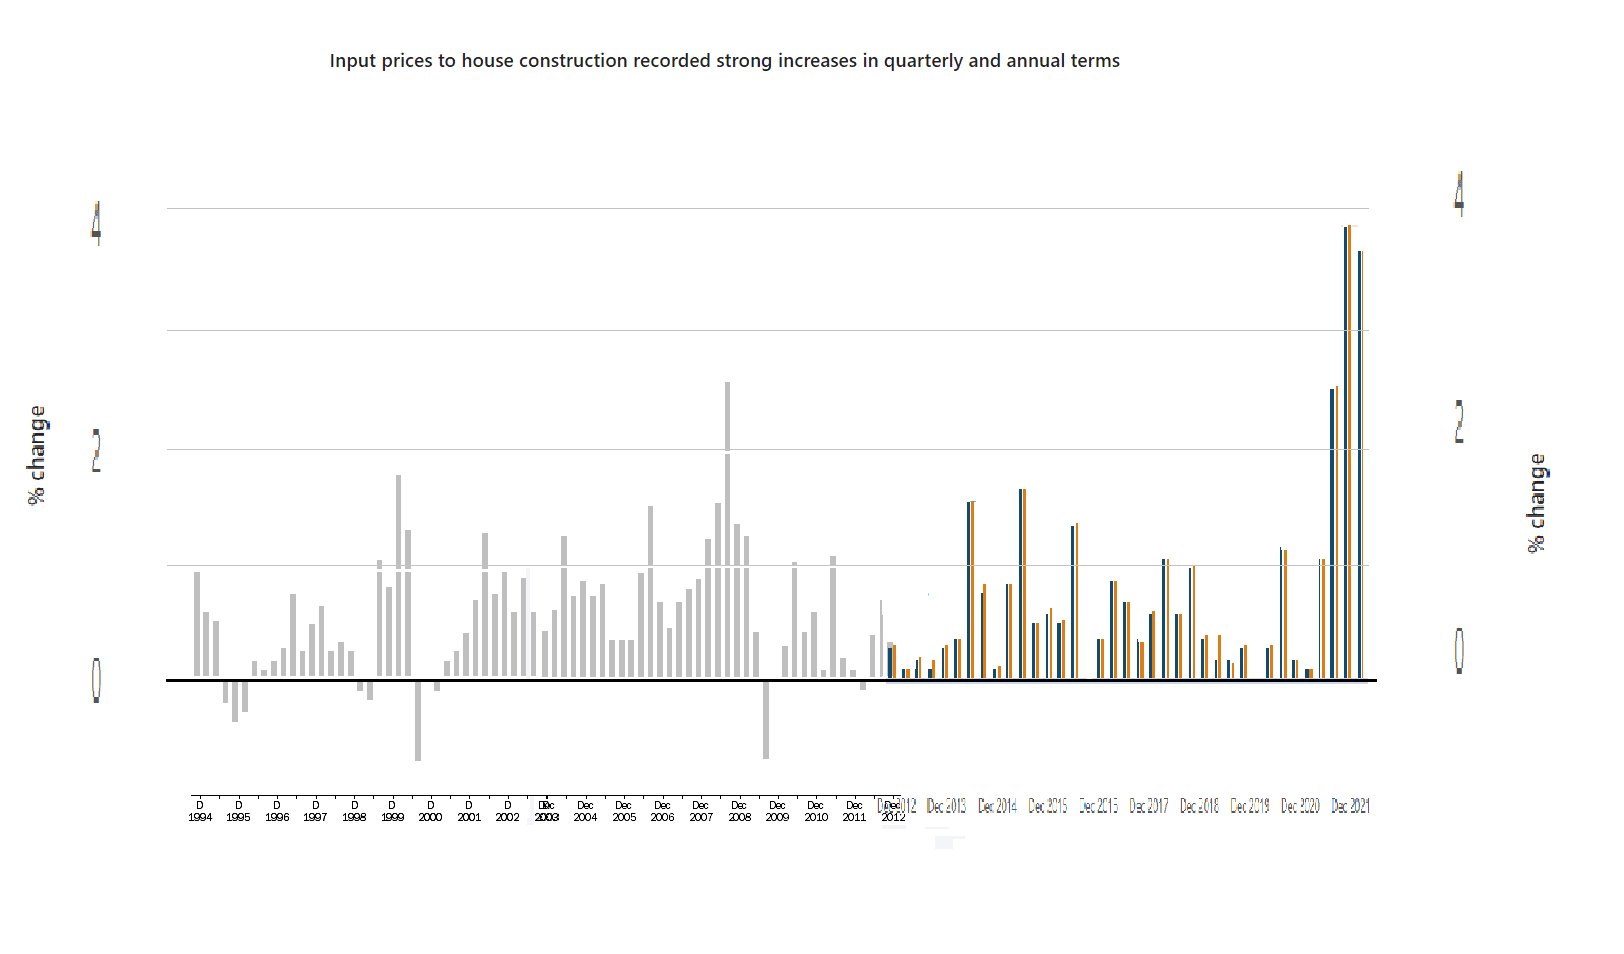
- The average quarterly change during the last 30 years was 0.5%
- The average annual change was 2%
- In the last year, input costs have increased by 12% (6 times the average)
- In 30 years, there have been only 9 quarters with deductions
- The maximum quarterly fall was -0.75% in both mar 2000 and dec 2009
- In 30 years, there have been 111 quarters with increases
- The last 3 quarters have all been record increases
- The highest quarterly increase was 4% in sept 2021
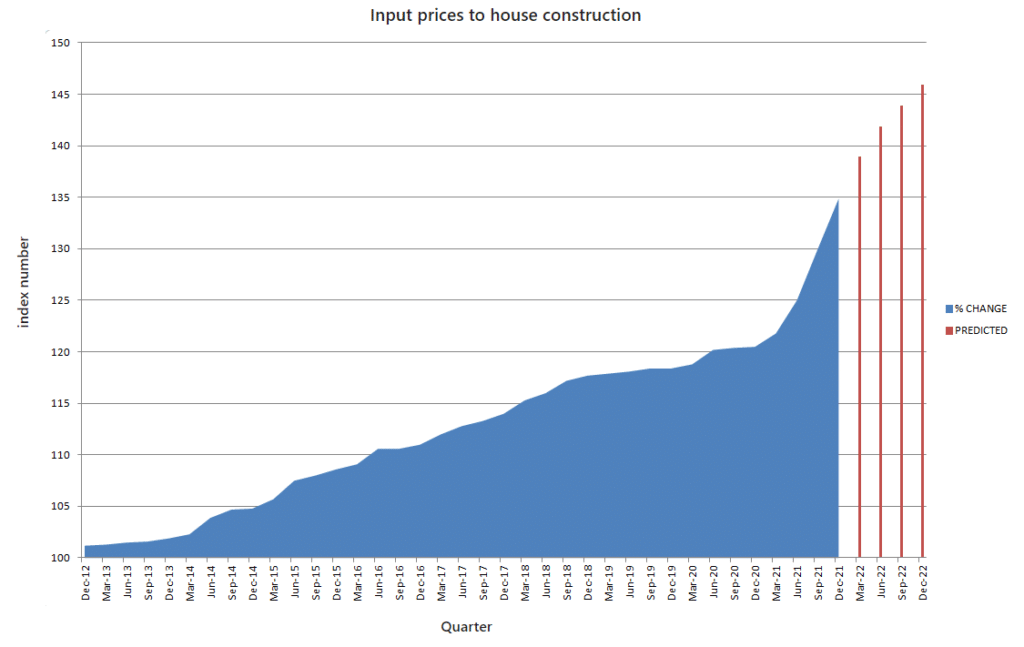
What can the past tell us about the future?
If history can show us anything, while costs may stabilize towards the end of this year, perhaps back to 1-2% pa, they will be unlikely to fall. The greater risk is that they continue to rise at unprecedented levels.
In the last 12 months, the input prices to house construction rose significantly due to increasing material costs and government grants in the residential sector continuing to stimulate demand for materials.
Suppliers struggled to meet demand due to stock shortages. Increasing international freight costs also contributed significantly to the strong rise for materials.
Over the past twelve months, Input prices to house construction rose 12.0%, mainly due to; Timber, board and joinery (+18.4%) and Other metal products (+13.2%).
In 12 months building costs increased 12%
Price indexes published by the Australian Bureau of Statistics (ABS) provide summary measures of the movements in various categories of prices over time. They are published primarily for use in Government economic analysis. Price indexes are also often used in contracts by businesses and government to adjust payments and/or charges to take account of changes in categories of prices (Indexation Clauses).
Input prices to house construction recorded strong increases in quarterly and annual terms
Input prices to house construction increased in line with increased costs and strong demand for building materials, the main contributors were:
- Timber, board and joinery (+6.0%), driven by structural timber (+15.4%), due to ongoing demand in all states, stemming from government stimulus and increasing international freight costs.
- Other metal products (+4.1%), driven by aluminium windows and doors (+3.0%), due to price rises in aluminium as a result of strong global demand and falling production outputs putting further strain on existing supply.
- Other materials (+1.8%), driven by paint and other coatings (+6.0%), due to rising prices as a result of tight supply and increasing import costs.
Quarterly input prices to house construction recorded rises due to strong increases for timber, steel and other metals
| Main contributors | quarter | annual |
|---|---|---|
| Timber, board and joinery | 6 | 18.4 |
| Other metal products | 4.1 | 13.2 |
| Other materials | 1.8 | 6.8 |


